
The Real Cost of AI-Augmented Software Delivery: $8.52 Per Story Point, Real Savings with Caching
We delivered multiple apps and solutions with our AI-augmented delivery factory. Here are our measured costs across multiple engagements, at public list prices. Cost per agent, sprint, and story point.
Fourth in a series. The first argued that speed without governance is a liability. The second described the specialist agents and enforced gates that make governed AI delivery work, with a short version for platform owners in Build with One Developer, Not Ten. The third went inside verification: who checks the work, and what stops them from marking their own homework. This one puts a price on it all.
On this page
- Everyone measures AI coding cost.
- What we measured: $8.52 per story point
- What vibe coding costs, and why that is a different question
- What is actually published in 2026
- The counter-evidence is serious
- Prompt caching cost savings: 89% on identical output
- AI agent cost is concentrated in a handful of sessions
- Bigger stories are cheaper per point
- Governance costs more than code
- The 4.4x spread is the real finding
- Cost per story point, with and without AI
- How we measured it, and the four bugs that nearly fooled us
- What this changes in a pricing conversation
- What these numbers are not
- What to ask any AI delivery partner
- FAQ
Everyone measures AI coding cost. We divide it into various categories.
Gartner expects AI coding cost to overtake the average developer’s salary by 2028. Two things drive that: rising token consumption, and the shift from seat pricing to consumption pricing (Gartner, 24 Jun 2026). Their survey data puts nearly a quarter of technology leaders at $200 to $500 per developer per month on tokens. Six percent are above $2,000.
Those are consumption numbers. Each one answers what an organisation spent on AI coding. None answers what it got back.
That gap is what this article is about.
The market sells speed, not cost
Speed multiples are everywhere. Thirty percent faster. Fifty-five percent time saved. Six months down to eleven days.
We have quoted one ourselves. In the first article in this series we described a fifty-person team cut to five. We flagged those figures for what they were: a composite, built from patterns across engagements rather than one ledger. We also said we would replace them with real ones.
This is that article.
A price with no denominator is not a price
The missing number is AI coding cost per unit of delivered work. A buyer hears that the work will be faster and cheaper, then gets nothing to hold anyone to. No cost per feature. No cost per ticket. No cost per point.
Subscription pricing shows what the tools cost. Token dashboards show what the agents consumed. Neither gets divided by what the team produced, and the two halves rarely appear in the same document. So “cheaper” survives as a claim, because nobody does the division.
We have now done it.
What we measured: $8.52 per story point.
Six engagements had complete transcript coverage. They delivered 517 story points. Measured model spend across them was $4,404, or $8.52 per delivered story point.
The wider set runs to nine engagements, 618 delivered points, and 52,654 individually priced model turns. The median sprint cost $146. A typical story cost about $33.
Two caveats come before anything else.
We computed every figure at public list prices, not from invoices. That makes it what the same work would cost anyone at published rates, so it is comparable rather than proprietary.
And in places it is a floor. Some subagent transcripts expired before we counted them. We excluded two projects outright for thin coverage. Where we could not bound a figure defensibly, we left it out instead of estimating. There is no cost per requirements document here, because the bounds came out twenty to eighty-five times wide. There is no cost for a large story either, because we have not delivered one inside the window. We state those gaps rather than fill them.
Two results we did not expect
The data supports two findings, and both cut against how the market sells AI delivery.
Governance cost more than writing the code. Process and audit work took 38% of identifiable spend. That covers gate checks, handovers, evidence records and retrospectives. Building took 26%. So the largest line item in this model is proving the work correct, not producing it. We are not apologising for that. It is the product. But anyone who models AI coding cost as the price of generating code is modelling about a quarter of the bill.
Prompt caching, not model choice, was the dominant lever. Cache reads made up 96.9% of all input volume. Priced without caching, the same work would have cost roughly $39,030 instead of $4,404. That is an 89% difference, and it comes from how we structure and reuse context. Model selection is the lever everyone reaches for first. On this evidence it is the second-order one.
The rest of this article takes both apart, then shows the method underneath. If you want the AI coding cost of your own delivery, this is the procedure.
What vibe coding costs, and why that is a different question.
Search for vibe coding cost and the answer arrives as a subscription table. Editors and app builders run roughly $16 to $50 a month. Active building pushes that two to three times higher once credits and token overages land. Sustained daily work lands nearer $300 to $450 a month. A production application comes in somewhere between $2,000 and $15,000 all-in, and a professional rebuild afterwards runs $5,000 to $30,000.
Those figures are honest. They are also all AI coding cost as consumption, and they help a CIO evaluating a delivery partner very little. Three reasons.
No denominator. Three hundred dollars a month is cheap if it shipped a quarter of the roadmap. It is expensive if it shipped one screen. Every published vibe coding cost figure we found is a numerator with nothing under the line.
Different product. Vibe coding, in the original sense, means accepting model output without formal review. The real cost of that is not the token bill. It is the security review, the rework, and the rebuild, and all three land later and on someone else’s budget line. Our $8.52 already includes an independent QA gate, live browser verification, and a spec-blind panel, because a story is not done without them. Those layers sit in the verification article. They are also 38% of the bill.
Why the comparison does not settle anything
No method. The genre is first-person. Forty-seven dollars of tokens on one feature. Eighty-one thousand in a week on a side project. Both are real and neither is a benchmark, because there is no sample, no denominator, and no procedure anyone can rerun.
So the honest framing is not that governed delivery beats vibe coding on price. Per token it is almost certainly more expensive, since it pays for verification that vibe coding skips by definition. Our claim is narrower and more useful. We know what we spent, on what, and we can show the working.
What is actually published in 2026.
We looked for a comparable figure first. Anyone at all, vendor or researcher, dividing AI delivery spend by delivered scope. We did not find one.
What exists falls into three groups. None of them is an AI coding cost per unit of delivery.
Per-seat subscription pricing. AI-native editors sit at $15 to $40 per month. Agentic coding tools run from $20 to $500 and up (Bhati, Agentic AI in the Software Development Lifecycle, arXiv:2604.26275, 29 Apr 2026). That tells a buyer the tooling cost per developer, and nothing about what the developer delivers.
Cost per task, as a model benchmark. Artificial Analysis and others publish cost-per-task next to capability scores, and agent harnesses commonly land between $0.03 and $2.60 per task. But a task there means a benchmark instance. It is not a governed unit of client scope with acceptance criteria, QA and an audit record attached. The denominators differ, and treating them as equivalent is the most common analytical error in this market.
Anecdote. Practitioner blog posts, covered above. Honest, and not benchmarks.
Gartner describes our finding from the outside
The Gartner analysis rewards reading past the headline. Their named failure modes are ungoverned agent autonomy, bloated context windows, and no structured feedback loop on usage. Their recommendations include routing simple tasks to smaller models, mandating context engineering, and moving token reviews inside the development cycle.
That describes session shape and governance. They reached it independently, from survey data rather than transcripts. Our numbers say the same thing with a decimal point attached. Context volume beats model price, and the discipline controlling it is a process property rather than a tooling one.
Independent corroboration on caching
PointFive, Token Reduction Is Not Cost Reduction, 6 Aug 2026 analysed 2,908 paid coding sessions across 103 tasks, seven repositories and three models. Two findings matter here.
Roughly 80% of the bill was prompt-cache traffic: repeated instructions, tool definitions and context. Only 1.3% was text the model saw for the first time. And counterintuitively, cutting tool-output tokens by 38.4% raised billed cost by 6.8%, because a stripped-down agent burns extra turns rediscovering what it used to hold in context.
One caution matters. Our 96.9% is a share of input token volume. PointFive’s 80% is a share of billed dollars. These are different metrics and nobody should read them as the same number. What they agree on is the shape of the bill.
Gartner is describing our finding from the outside
The Gartner analysis that opens this article is worth reading past the headline. Their named failure modes are ungoverned autonomy in agent-driven workflows, bloated context windows, and no structured feedback loop to improve usage. Their recommendations include routing simpler tasks to smaller models, mandating context engineering practice, and putting token reviews inside the development cycle rather than beside it.
That is a description of session shape and governance, arrived at independently, from survey data rather than transcripts. Our measured numbers say the same thing with a decimal point attached: context volume beats model price, and the discipline that controls it is a process property, not a tooling one.
On prompt caching, there is independent corroboration
PointFive, Token Reduction Is Not Cost Reduction, 6 Aug 2026 analysed 2,908 paid coding sessions across 103 tasks, seven repositories and three models. Two findings matter here. Roughly 80% of the bill was prompt-cache traffic, meaning repeated instructions, tool definitions and context, while only 1.3% was text the model was seeing for the first time. And counterintuitively, cutting tool-output tokens by 38.4% increased billed cost by 6.8%, because a stripped-down agent spends extra turns rediscovering what it used to have in context.
One caution, because it matters. Our 96.9% is a share of input token volume. PointFive’s 80% is a share of billed dollars. These are different metrics and should not be read as the same number. What they agree on is the shape of the bill.
The counter-evidence is serious.
The credible case against AI delivery economics is stronger than the vendor literature admits. This article is more useful for saying so plainly.
The best study declines to state a number
METR ran the only randomised controlled trial of note. In early 2025, experienced open-source developers came out 19% slower with AI tools while believing they were 20% faster (METR, 10 Jul 2025).
The follow-up is more interesting than the headline suggests. Across 800-plus tasks, 57 developers and 143 repositories, the new cohort showed minus 4% and the original cohort minus 18%. Both confidence intervals cross zero. METR then changed the experiment design, citing selection bias in recruitment and task submission, and called the evidence very weak (METR, 24 Feb 2026).
Cost moves into maintenance
GitClear analysed 623 million changes between 2023 and 2026 for The Maintainability Gap. Code block duplication rose 81%. Refactoring line moves fell 70%. Long-term legacy maintenance fell 74% against 2022. Error-masking constructs rose 47% (GitClear).
That is the strongest evidence available that AI delivery shifts cost from build into maintenance rather than removing it.
Lightrun and Global Surveyz surveyed 200 senior SRE and DevOps leaders in early 2026. Forty-three percent of AI-generated changes needed manual debugging in production, after passing QA and staging. Eighty-eight percent needed two to three redeploy cycles to verify a fix. Developers spend roughly 38% of the working week debugging and verifying AI code (VentureBeat, 14 Apr 2026). Self-reported survey data, not instrumentation, which is worth saying.
DORA keeps finding that AI adoption raises throughput and reduces delivery stability (DORA publications). The mechanism is large batch sizes plus a verification burden on code that reads as correct.
So are we cheap or expensive?
Honestly, we cannot say. No published comparable exists to be cheap or expensive against, and that absence is itself the finding.
Where the outside evidence meets ours, the two agree. Lightrun finds engineers spending about 38% of the week verifying AI output. We find 38% of identifiable spend going to process and audit. The denominators differ, one human time and one model dollars, and the coincidence cannot carry more weight than that. Still, both point at one structural fact. Verification is not a tax on AI-augmented delivery. It is a large share of the work.
Prompt caching cost savings: 89% on identical output.
Ask an engineering team about AI coding cost and you get a model-price answer, every time. This much per million input tokens, that much per million output. The framing aims optimisation effort at the variable with the least leverage.
We metered 332 real delivery sessions across six projects. The bill was not the shape anyone expected.
It is a reading workload, not a writing one
Cache reads are 96.9% of all input volume, and they bill at one tenth of the standard input rate. That single fact reorganises everything else.
The other end sharpens it. Output is 0.29% of input volume. So we are not paying a model to write code. We are paying it, turn after turn, to re-read the whole conversation before it writes three lines. The artifact is a rounding error against the cost of knowing enough to produce it.
Priced without caching, the same volume would have cost roughly $39,030. Actual spend was $4,404. Prompt caching saved 89%, or $34,626, on identical output.
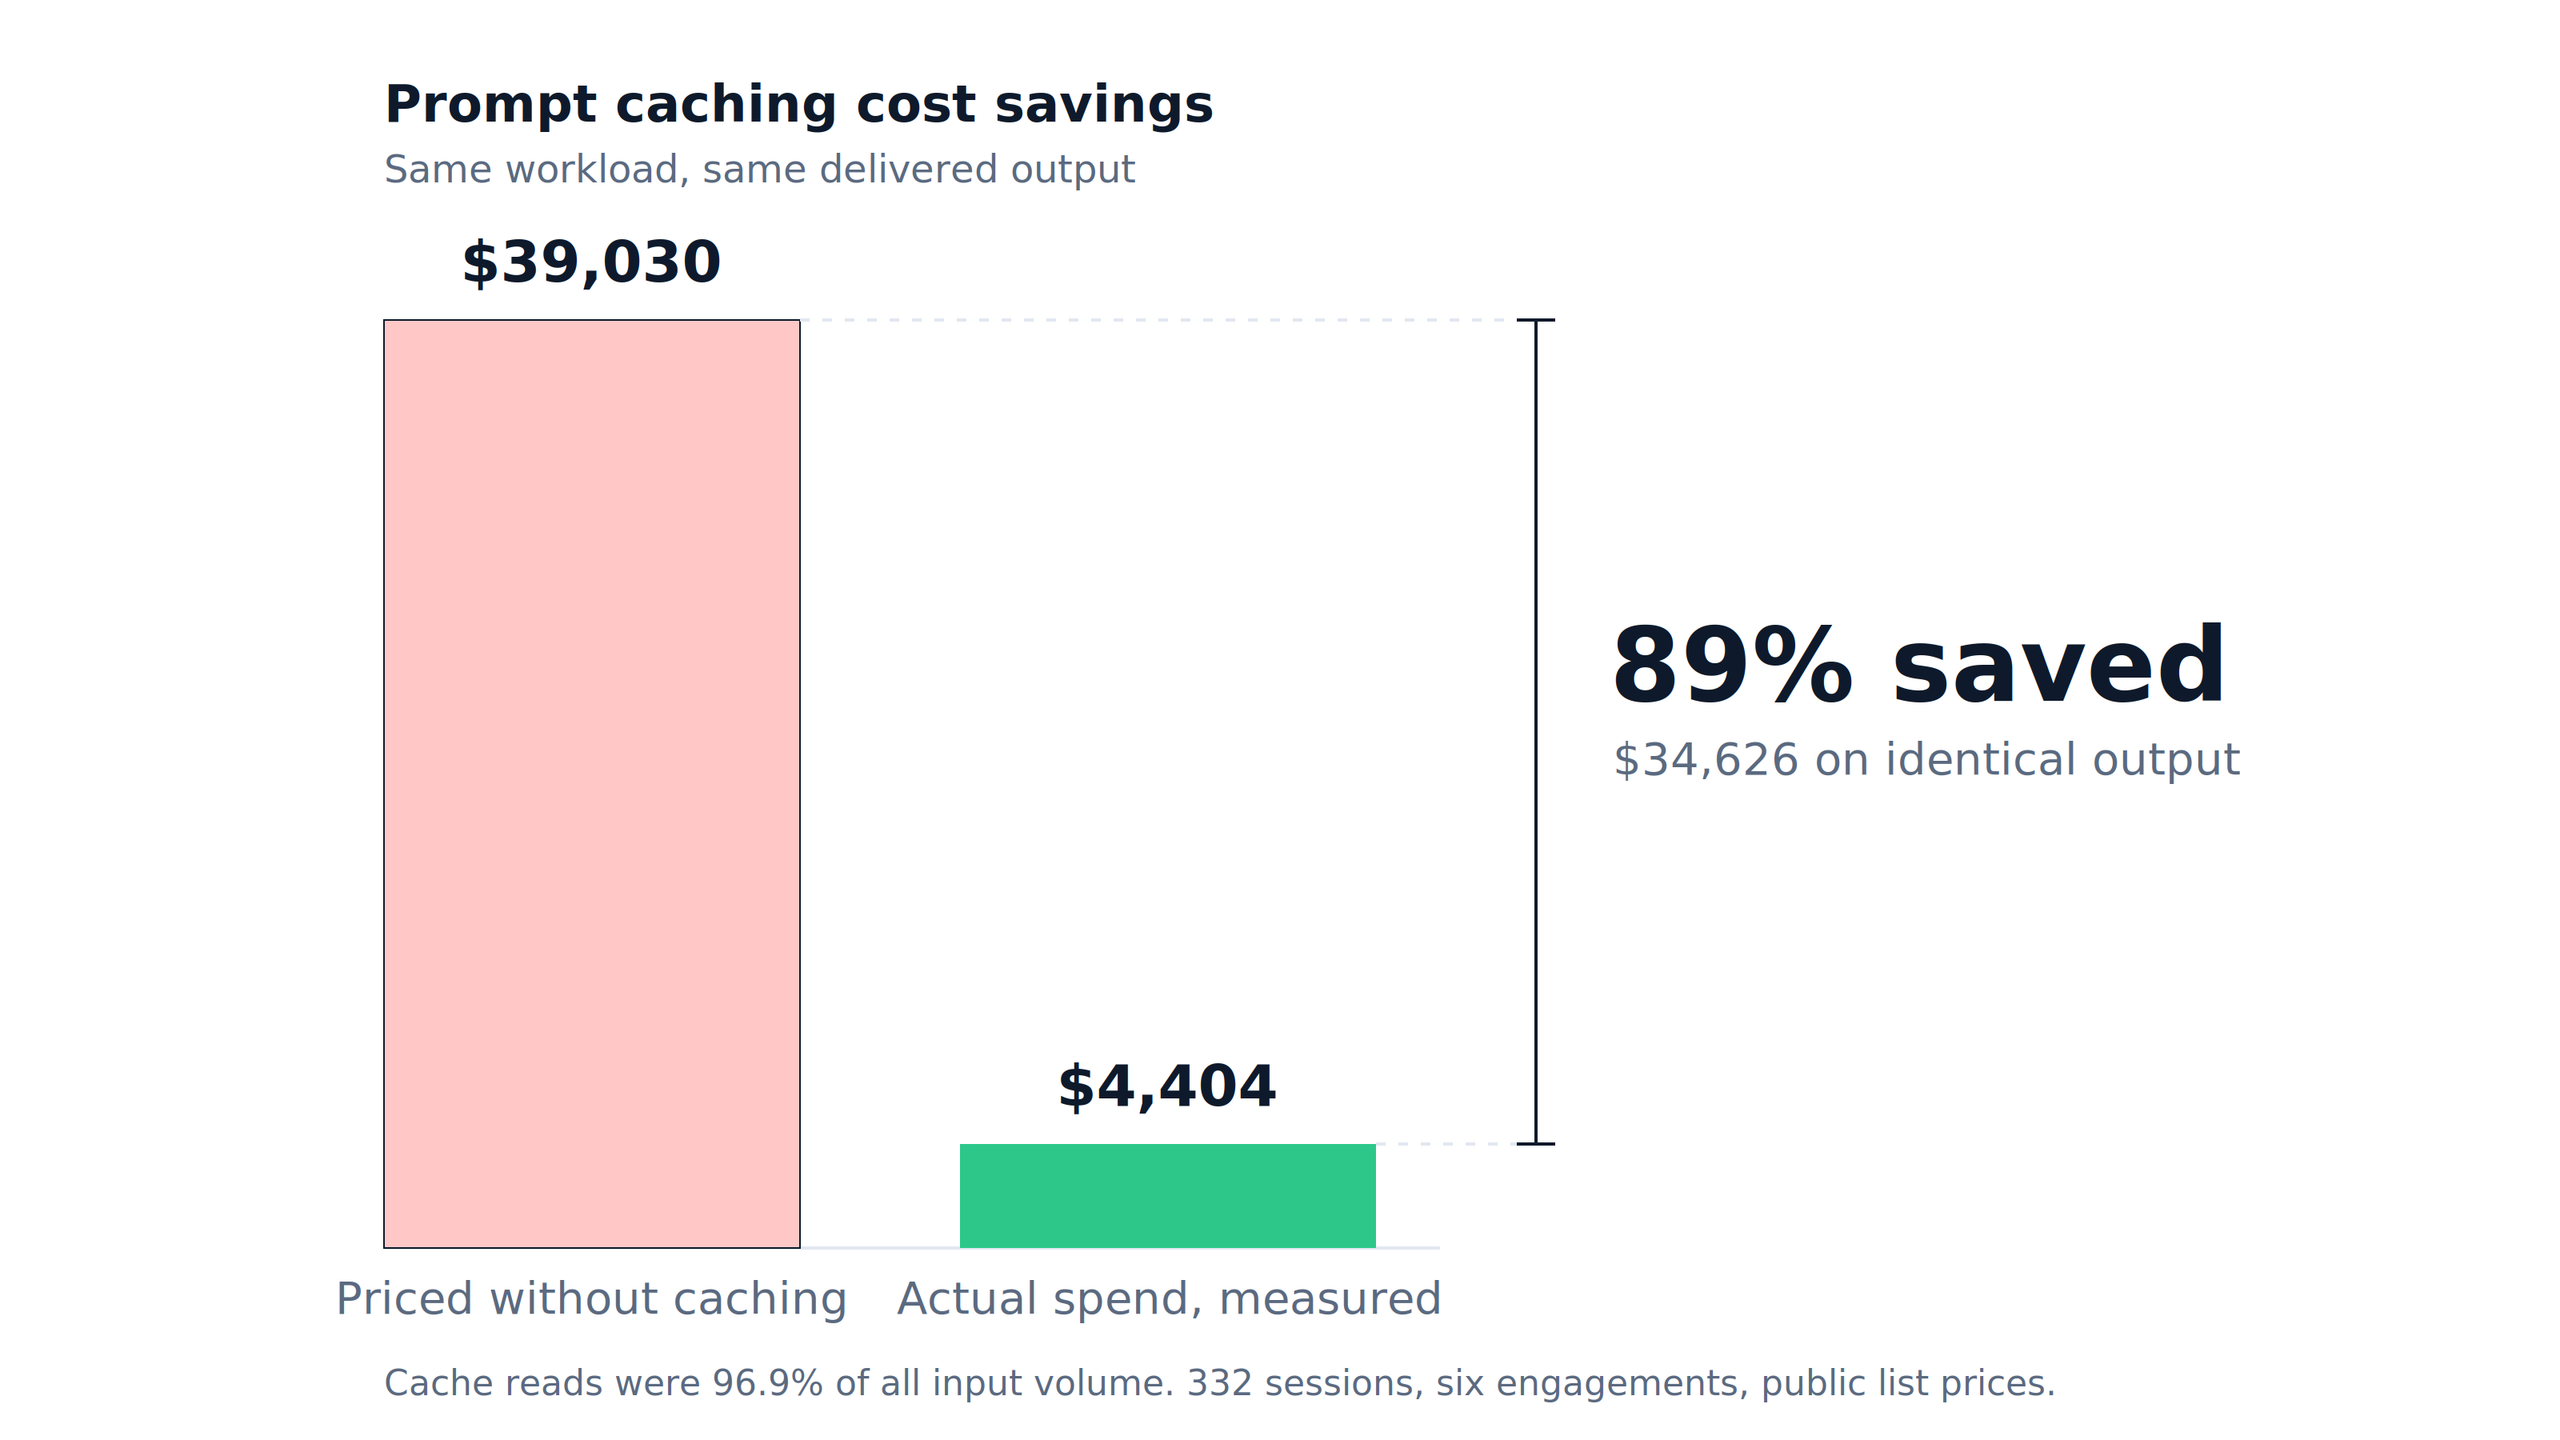
Figure 1. Measured model spend of $4,404 against the same workload priced without prompt caching at roughly $39,030. An 89% difference, driven by a 96.9% cache read share.
The mechanism is public rather than proprietary. Anthropic prices cache reads at 0.1x base input tokens, with cache writes at 1.25x for the five-minute TTL and 2x for the one-hour TTL (prompt caching documentation). An 89% saving is what that multiplier does to a workload where 96.9% of input is a cache read. Anyone can reproduce it. Most people are not measuring whether they already have. If a vendor cannot tell you their cache read share, they do not know their own AI coding cost.
Session shape beats model choice
Cache reads scale with resident context, and context only grows inside a session. So a tight session stays cheap per unit of work, and an accumulating one does not.
Here is a measured example from our own retrospective, and it is not flattering. One session mixed two sprints, a six-project repository migration, and a set of framework changes. Seventy-nine percent of its usage sat above 150k context, where cache read exceeded output by roughly 250 times.
Nothing was wrong with the work. The session simply carried two sprints of history into every turn of the second one. Splitting at a natural boundary drops the multiplier substantially. It costs nothing, needs no tooling and no model change, and it stays invisible until someone reads a bill.
Compare that to the lever people reach for first. Sonnet 5 took 64.6% of spend at $0.18 per thousand output tokens, Opus 5 took 28.5% at $0.22. The gap is real and it is small next to an 89% caching effect. Downgrading the model saves at the margin and degrades the work. Splitting the session saves structurally and changes nothing.
AI agent cost is concentrated in a handful of sessions.
Across those 332 sessions the median session cost $4.31. The top ten sessions carried 39% of all spend. One session cost $266, which is 62 times the median.
That shape is not unique to us. The most detailed public dataset we found reports a median session of $6.51 against a mean of $94.30, and finds that a single token in a long agent session can be billed hundreds of times as the transcript gets re-sent.
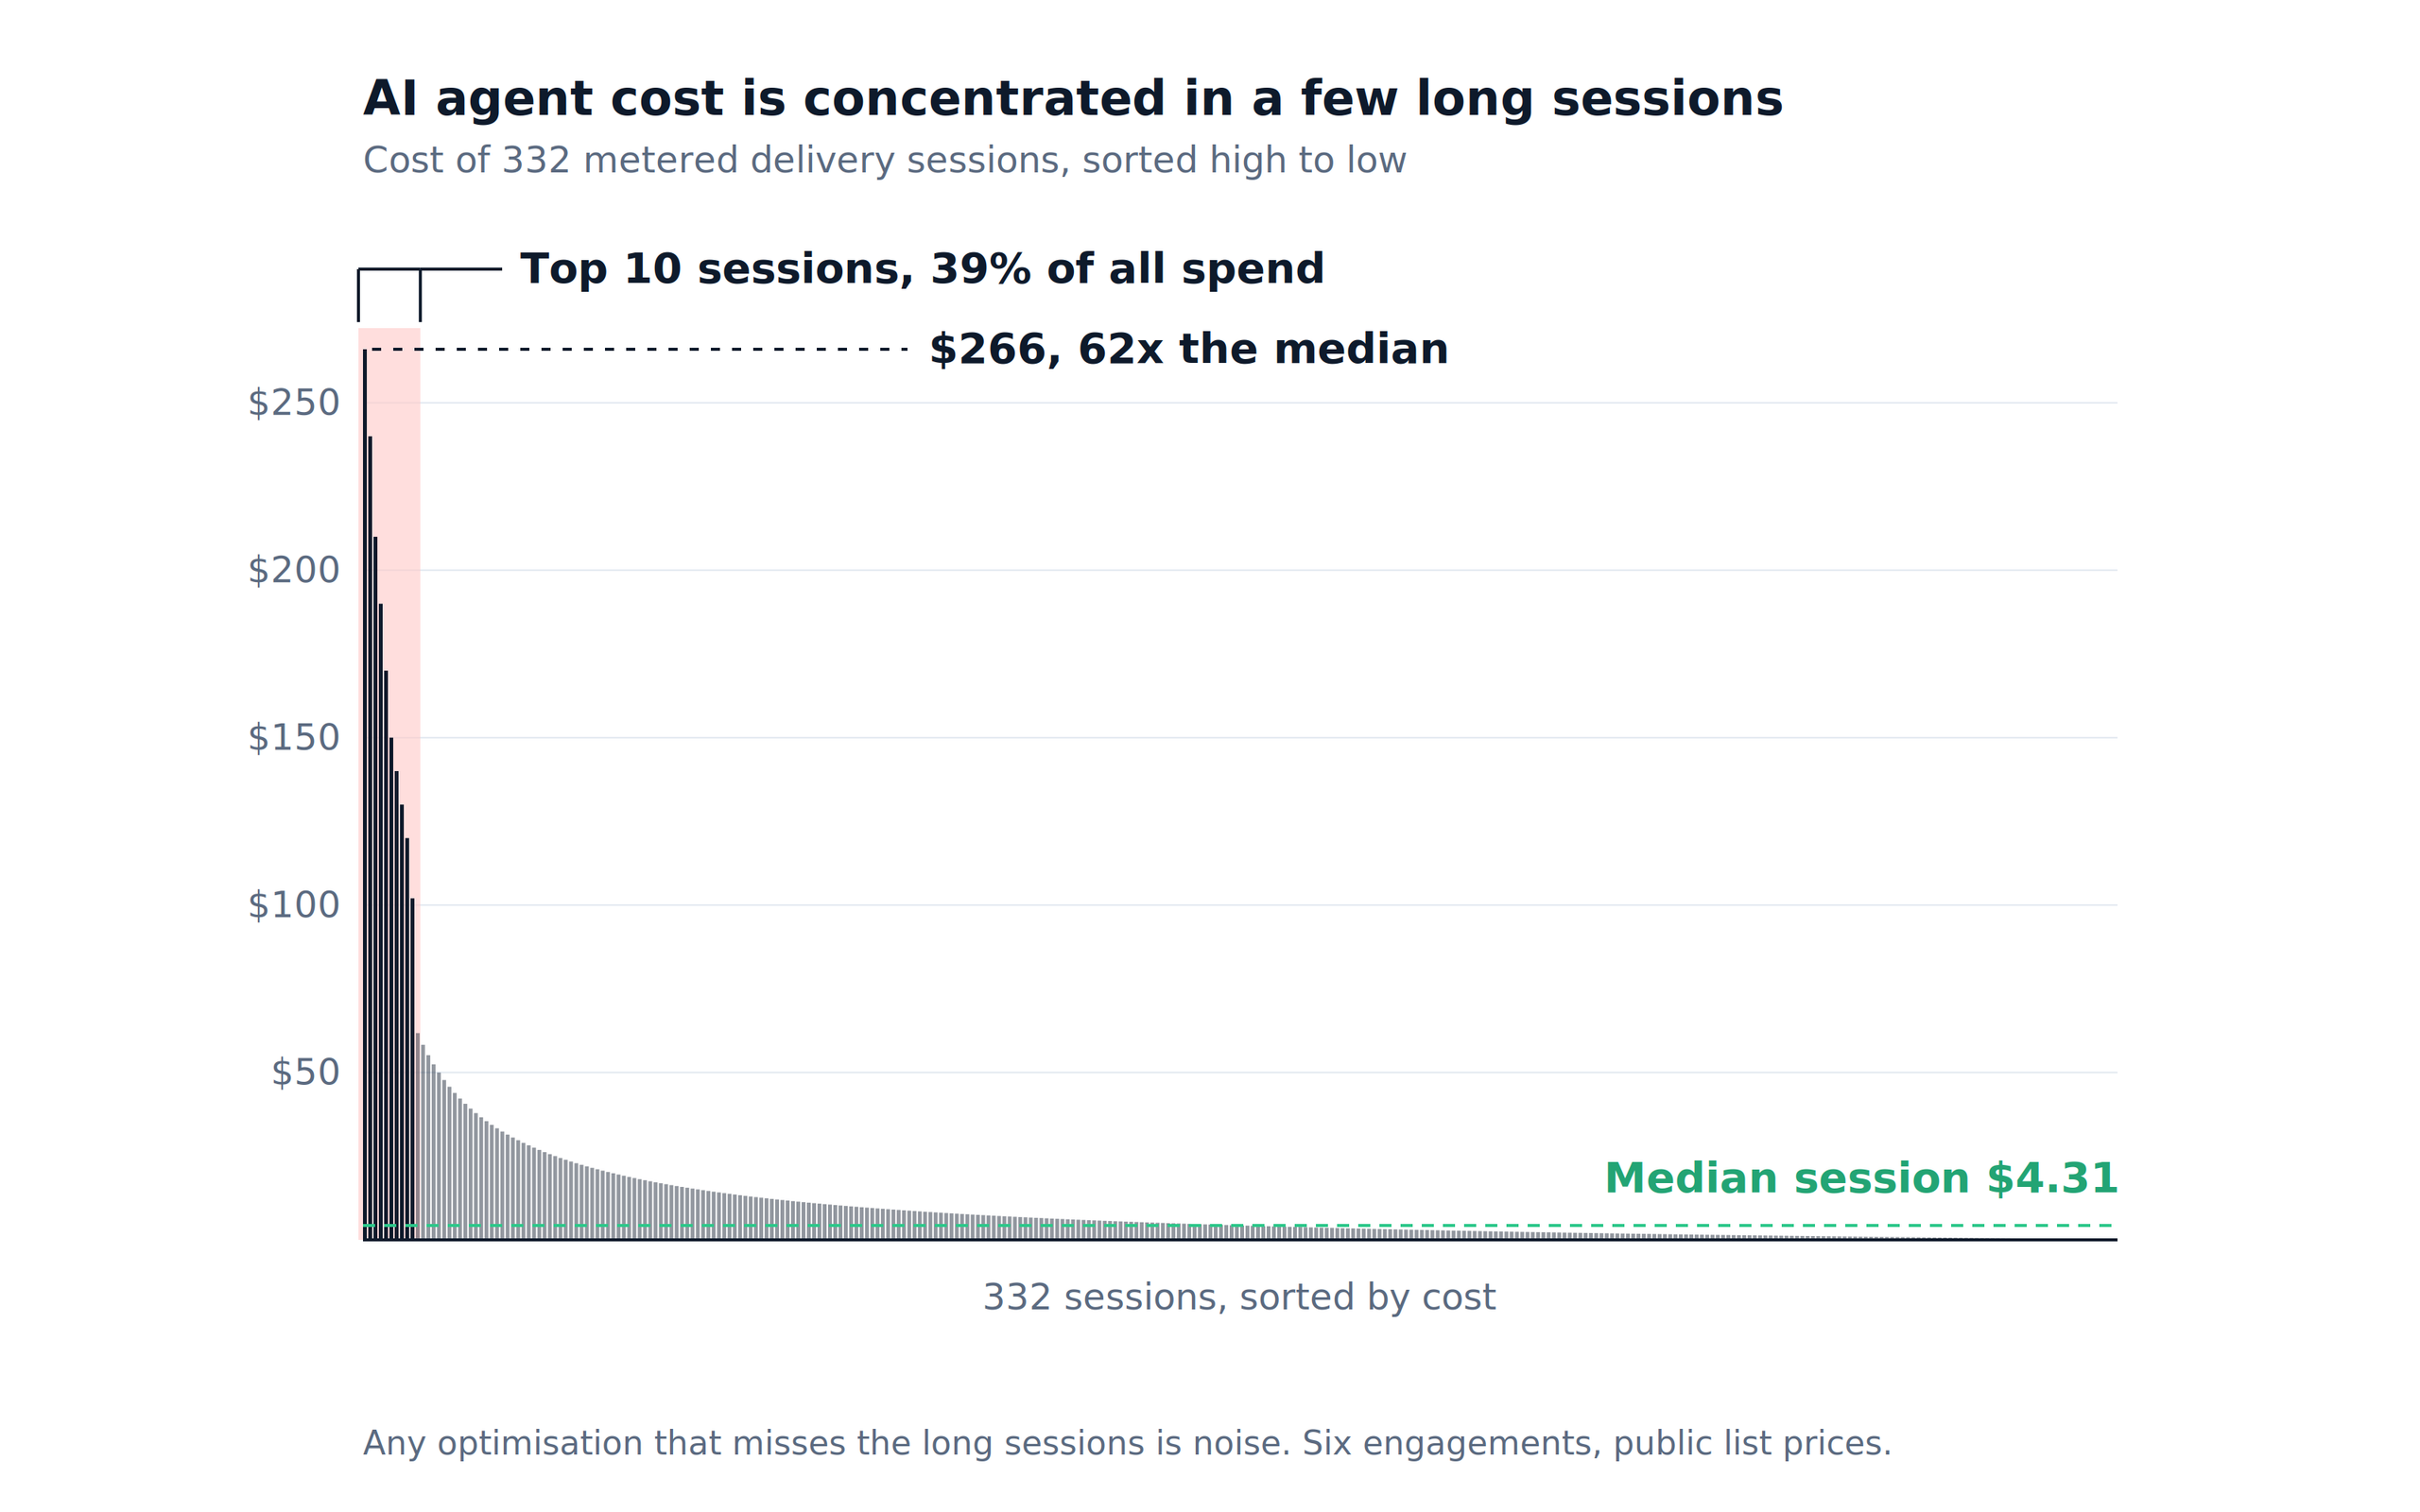
Figure 2. Cost of 332 metered delivery sessions, sorted high to low. The ten most expensive sessions carry 39% of all spend.
A tail that heavy has an unforgiving implication for AI agent cost control, and for AI coding cost generally. Any optimisation that misses the long sessions is noise. Shaving 20% off a typical four-dollar session saves 86 cents. The same discipline applied to the tail is worth two orders of magnitude more.
So put the attention at the top of the list, and specifically on why those sessions got long. Per-prompt frugality is close to pointless. Deciding what enters context at all is nearly everything.
Bigger stories cost less per point
We measured 53 stories with genuine start and end state transitions in the tracker, so the cost window is real rather than inferred.
| Story size | Median cost per point |
|---|---|
| Small (1 to 3 points) | $4.07 |
| Medium (5 to 8 points) | $3.43 |
Medium stories came in about 16% better per point. The mechanism is not mysterious. Picking a story up carries a fixed cost: loading context, orienting in the architecture, reading the handover, re-establishing what “done” means here. That cost gets paid once whether the story is worth one point or eight, so it amortises. Slicing a backlog very thin buys predictability and pays for it in setup.
One caveat. In both buckets the mean sits far above the median, because a handful of stories cost ten times the typical one. Plan with the median. The mean is what shows up on the invoice.
Governance costs more than code.
We spend more producing the audit trail than producing the code. Thirty-eight percent against twenty-six. In a conventional delivery shop that ratio is an efficiency scandal, and someone gets tasked with driving it down.
Code is the cheap part now, and everyone in this market can produce it. Trustworthy code is what stays scarce. That means an artifact arriving with a timestamped record of who decided what, what was checked against which criterion, and what was deferred and why. Such a record survives an audit, an incident review, or the person who built it leaving. So the 38% is the price of evidence, and the evidence is the differentiated good.
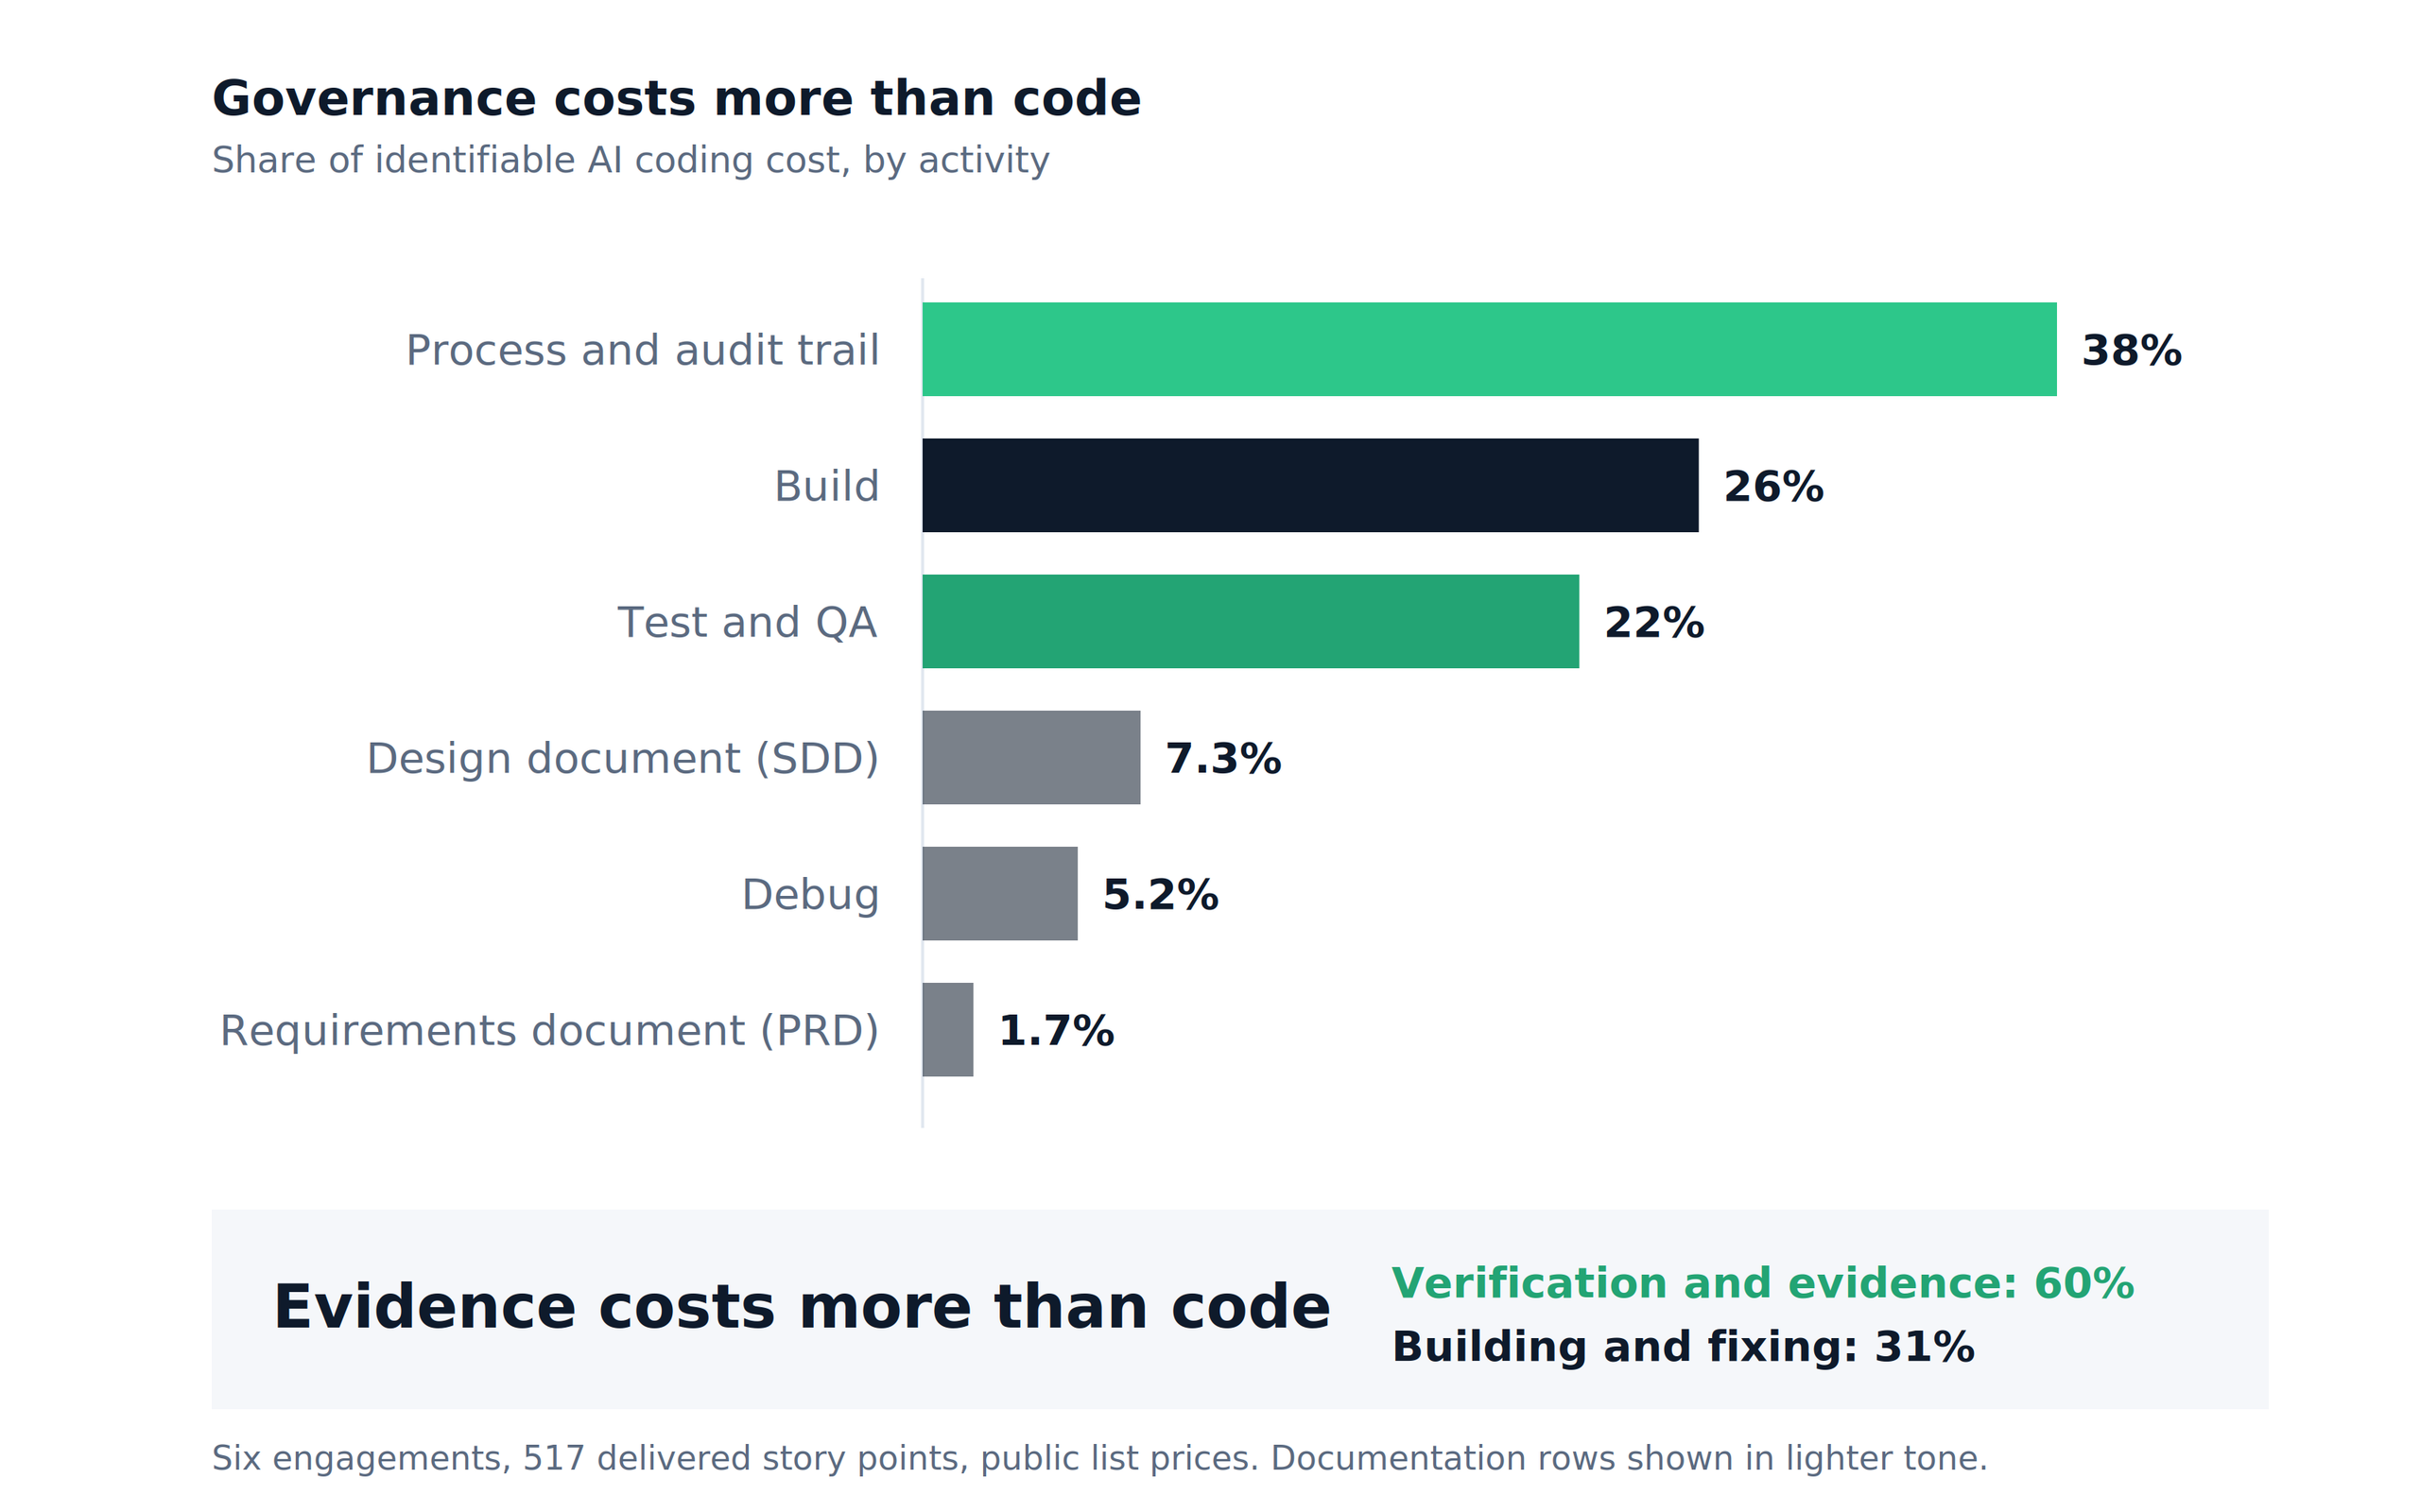
Figure 3. Share of identifiable spend by activity. Producing the audit trail costs more than producing the code.
The pattern repeats one level down. QA outspends debugging 4.3 to 1, at 8.0% of sprint spend against 1.9%. That is a model paying to find defects rather than chase them, and it is hard to fake, because it falls out of the transcript rather than the invoice. Two simulated UAT sprints cost $255 and delivered zero story points by construction. Verification produced no velocity at all, ran anyway, and stayed visible in the cost data.
If a partner sells governance and their cost data shows governance at 4% of spend, they are selling a story.
The 4.4x spread is the real finding.
The headline is the least interesting number in the dataset. The distribution is the story.
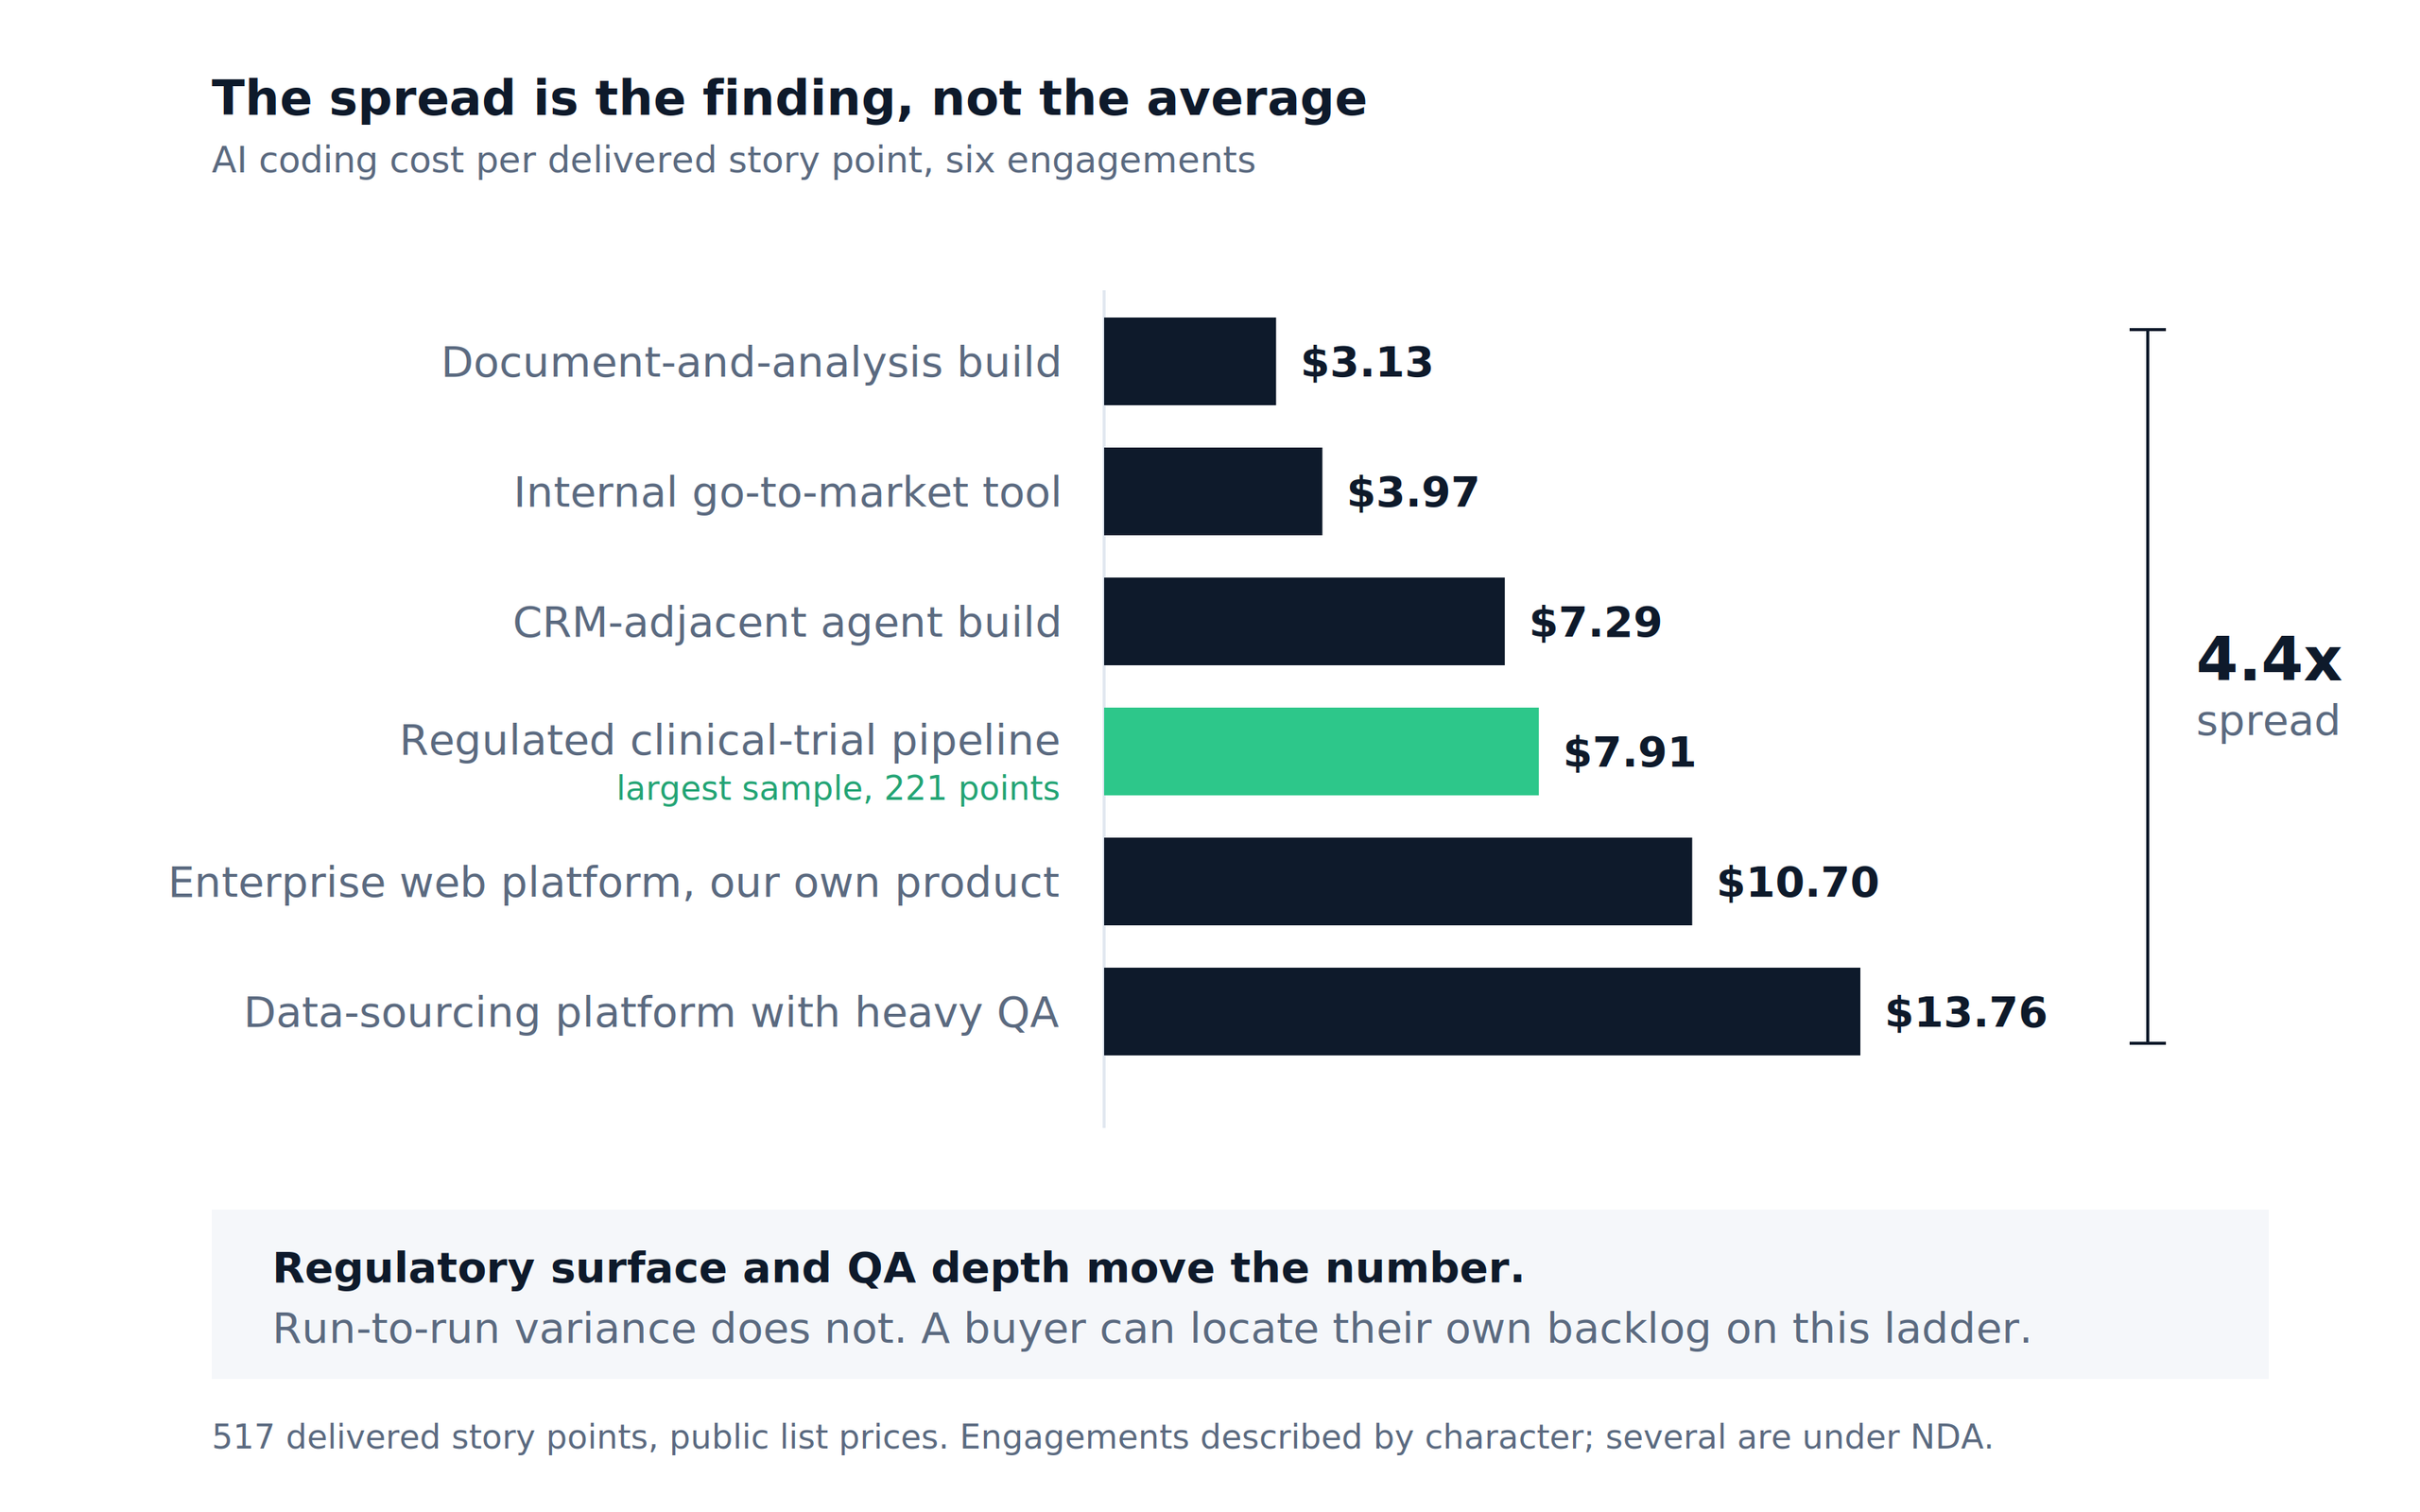
Figure 4. Cost per delivered story point across six engagements. A 4.4x spread that sorts by regulatory surface and QA depth, not by run-to-run variance.
We describe engagements by character rather than by name, because several sit under NDA.
That is a 4.4x spread, and it tracks the kind of work rather than the quality of the team. Analysis work is cheap per point because the artifact is the output. Platform build with serious QA is expensive because the same point carries a build, an independent verification, and the evidence that the verification happened.
Why the band is usable
The band is legible, which matters more than its width. A 4.4x spread is much narrower than the up-to-30x run-to-run variance reported on identical benchmark tasks. Regulatory surface and QA depth move our number. Run-to-run chaos does not. So a buyer can locate their own backlog on that ladder, which makes it usable for estimating rather than merely reporting.
A single blended rate destroys that information, and it destroys it asymmetrically. It overcharges the client whose backlog is discovery, and undercharges the one whose backlog is a heavily tested platform build. The model then bleeds on exactly the engagements it most wants to win. Every vendor whose fixed-price practice turned out to be subsidised by three easy accounts has learned this already.
So the defensible model is not one number. It is banded pricing by work shape: analysis and documentation, mixed application delivery, platform build with full QA. Publish the bands. Agree the band at scoping rather than at invoicing. Print the measured input cost beside the price, so margin stays visible rather than buried. The client then argues about which band their work sits in, which is a far more productive argument than whether a given day was well spent.
Cost per story point, with and without AI.
Cost per story point is not a new metric. Agile teams have calculated it for years: total delivery cost for a period, divided by points delivered in that period.
The standard worked example puts an eight-person team at $160,000 over fourteen weeks against 167 delivered points. That comes out at $958 per point, and many teams land around twice that (Mountain Goat Software).
Ours is $8.52.
Do not divide those two numbers
They are not the same denominator, and treating them as comparable would be exactly the error this article exists to argue against. The $958 is fully loaded labour. The $8.52 is model spend at list prices, with no human time, tooling or infrastructure in it. One is what a team costs. The other is what the models cost while that team works.
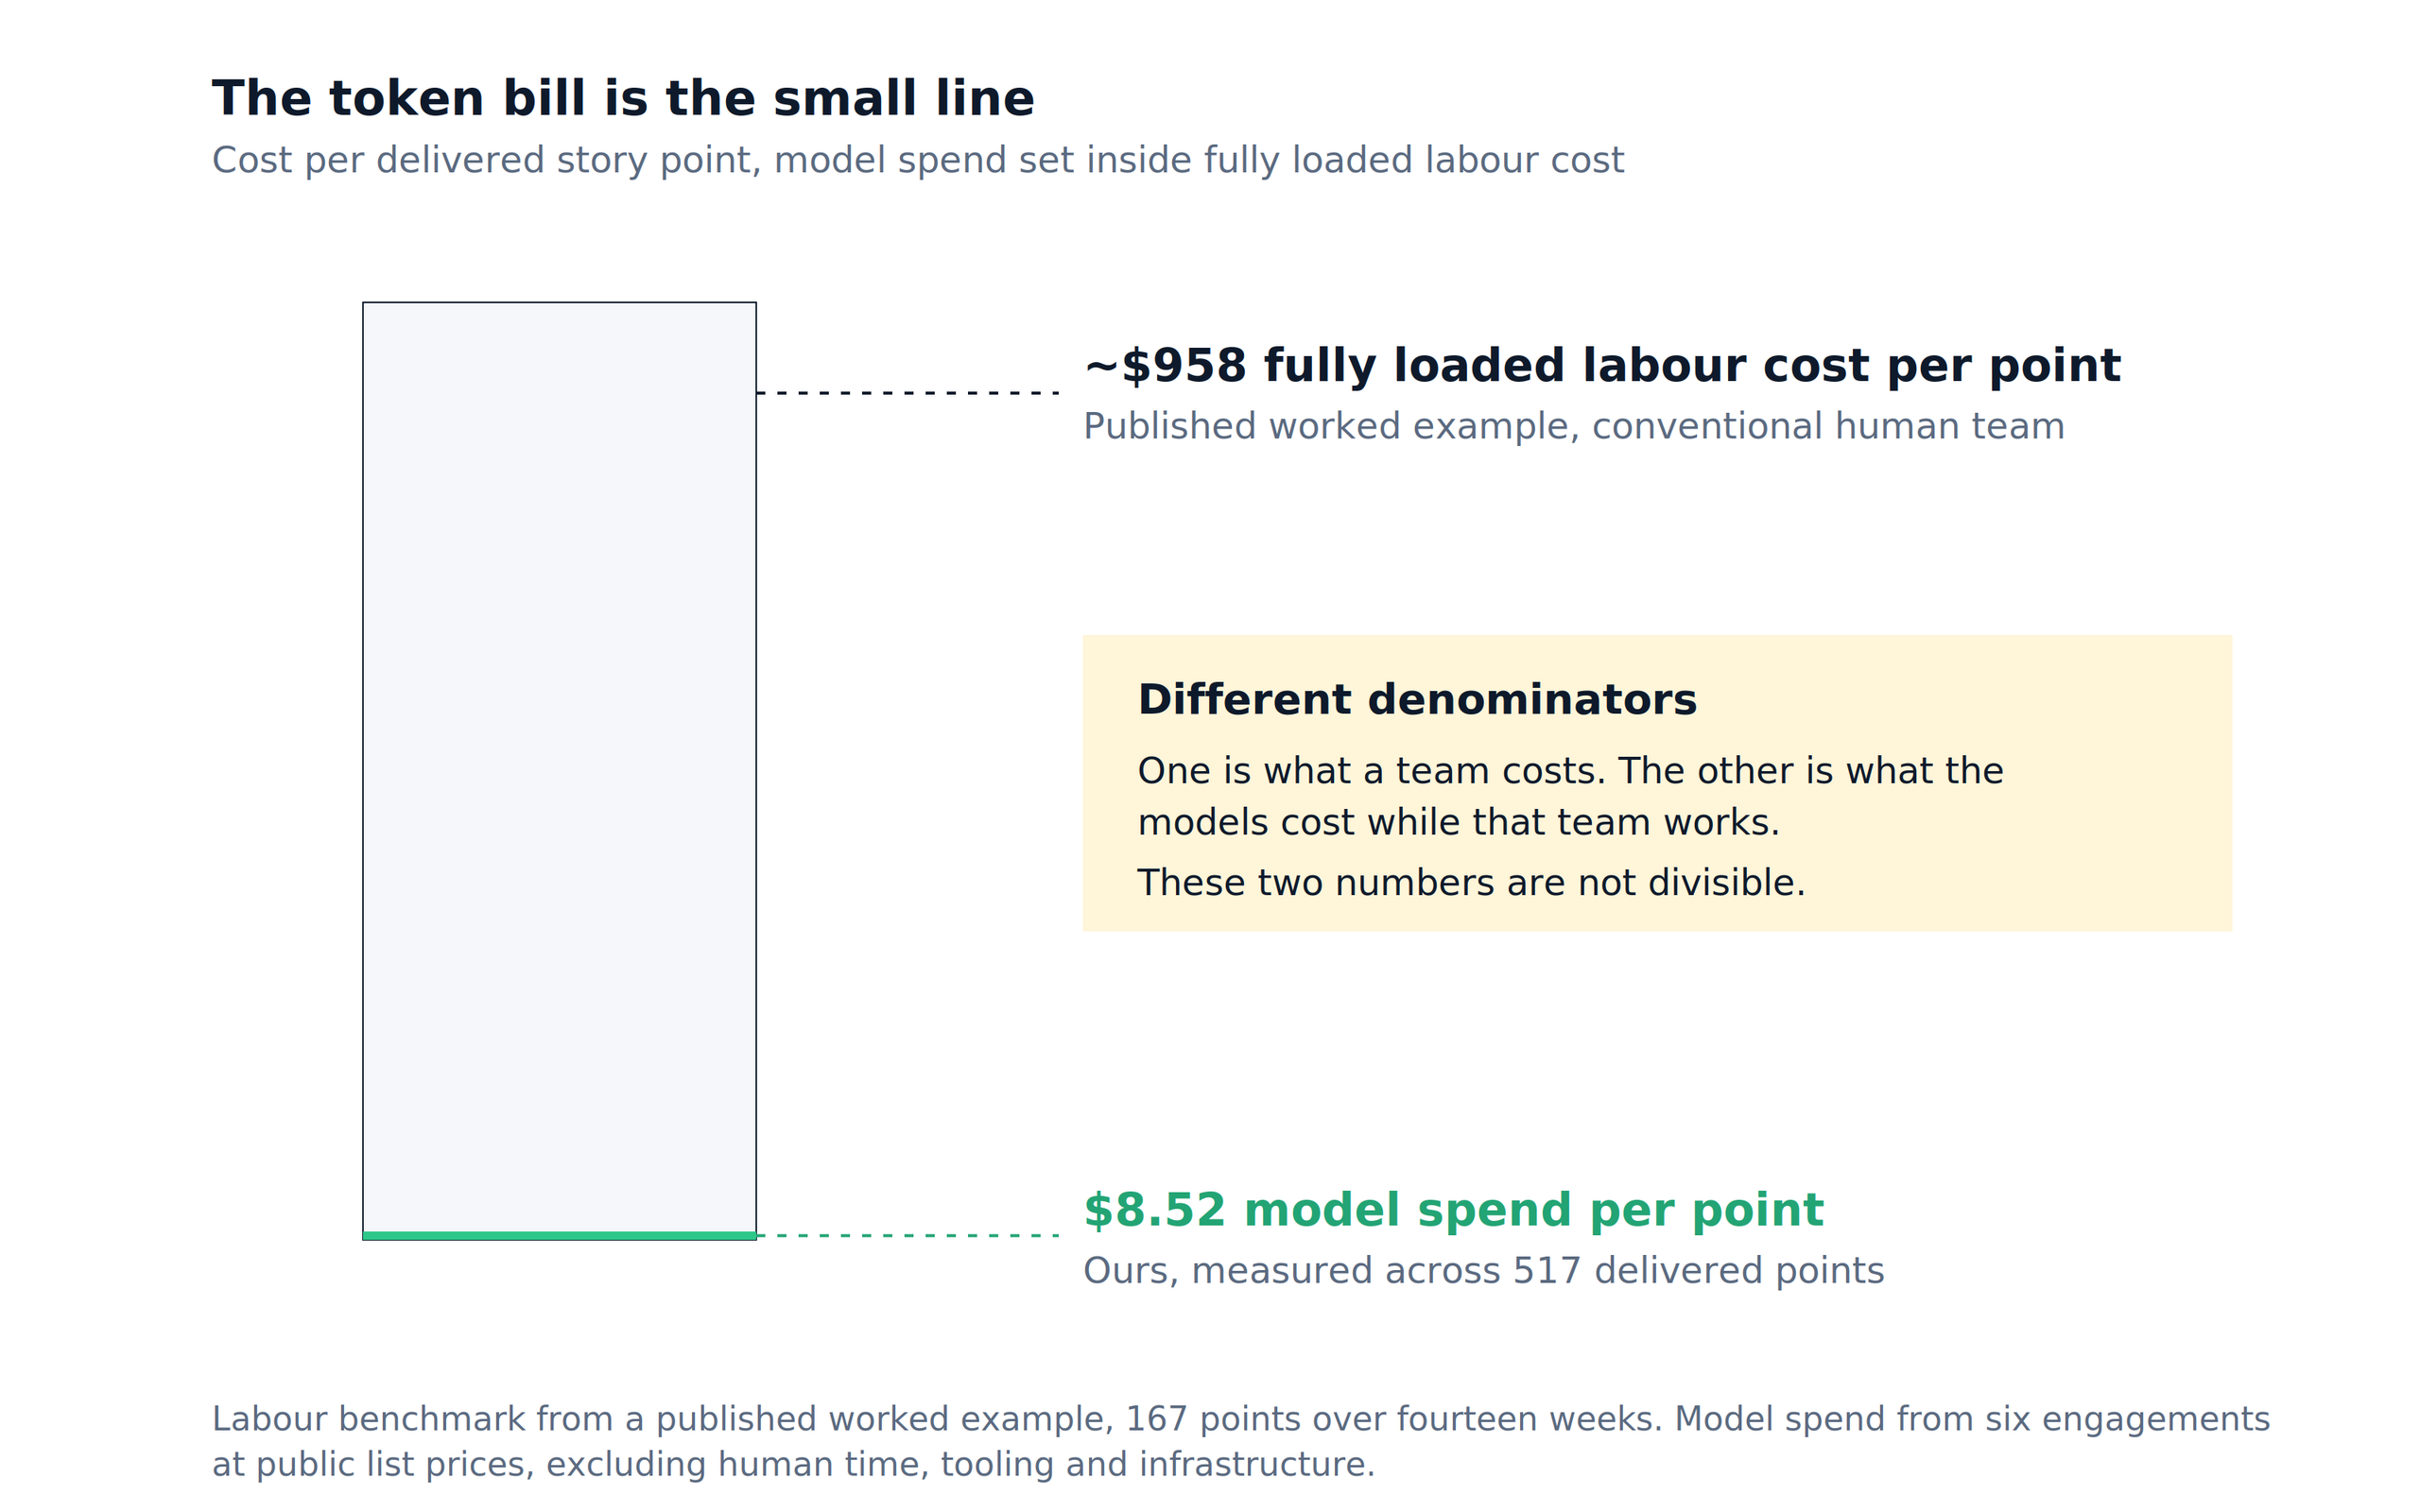
Figure 5. Model spend of $8.52 per point set inside a fully loaded labour cost per point near $958. Different denominators, shown at the same scale to make the proportion legible rather than to imply a saving.
Read carefully, though, the comparison gives a CIO something usable.
The token bill is not the expensive part of AI-augmented delivery. It sits at roughly one percent of the scale of the labour line beside it. So an organisation optimising its AI coding cost while leaving the delivery model unchanged is optimising the smallest number on the page. Gartner’s warning points at that gap closing, and the trend deserves attention. It is not yet the situation in our data, at our cache read share, on this work.
The labour denominator is still what moves a budget, and this dataset cannot tell you what happens to it. We measured what the models cost. We did not run a controlled comparison against the same scope delivered conventionally. Nobody credible has, and the one randomised trial that tried found experienced developers slower with AI while believing the opposite.
So the useful claim stays modest. If a partner quotes you a headcount reduction, ask what the delivered points cost in both denominators, and how they know.
How we measured AI coding cost, and what went wrong {#method}
Any AI coding cost figure is only as good as the instrumentation underneath it. Read this section if you plan to run the same measurement yourself.
Ground truth comes from the billing path
The agent does not self-report token usage. The client attaches it to every assistant turn, straight from the API response: model, input, output, and the cache read and write split broken down by TTL. That is the billing path, and it is what we read. Nobody estimates anything.
The protocol it replaced asked a human to run a cost command at session close. Manual gates fail open, and this one did. Four consecutive sprints closed with every usage row marked unmeasured, while the exact figures sat unread in the transcripts. Nobody did anything wrong. The gate just had nothing behind it.
Four attribution bugs, none of which looked like a bug
Building the metering surfaced four bugs, and each produced a perfectly plausible number.
- Subagent transcripts carry no working directory. Their only project marker is a path slug. Match on the wrong thing and every project’s spend lands in one engagement. This inflated one reported total to $1,775.
- A snapshotted transcript is also still live. Count both copies and subagent spend silently doubles.
- Truncating timestamps to dates widens every sub-day window to a whole day. One sprint read $473 against its true $260, because two sprints closed on the same afternoon.
- A project-name regex anchored on the wrong path segment dumped 46% of all spend into an unattributed bucket, and read one project as $153 when the real figure was $1,337.
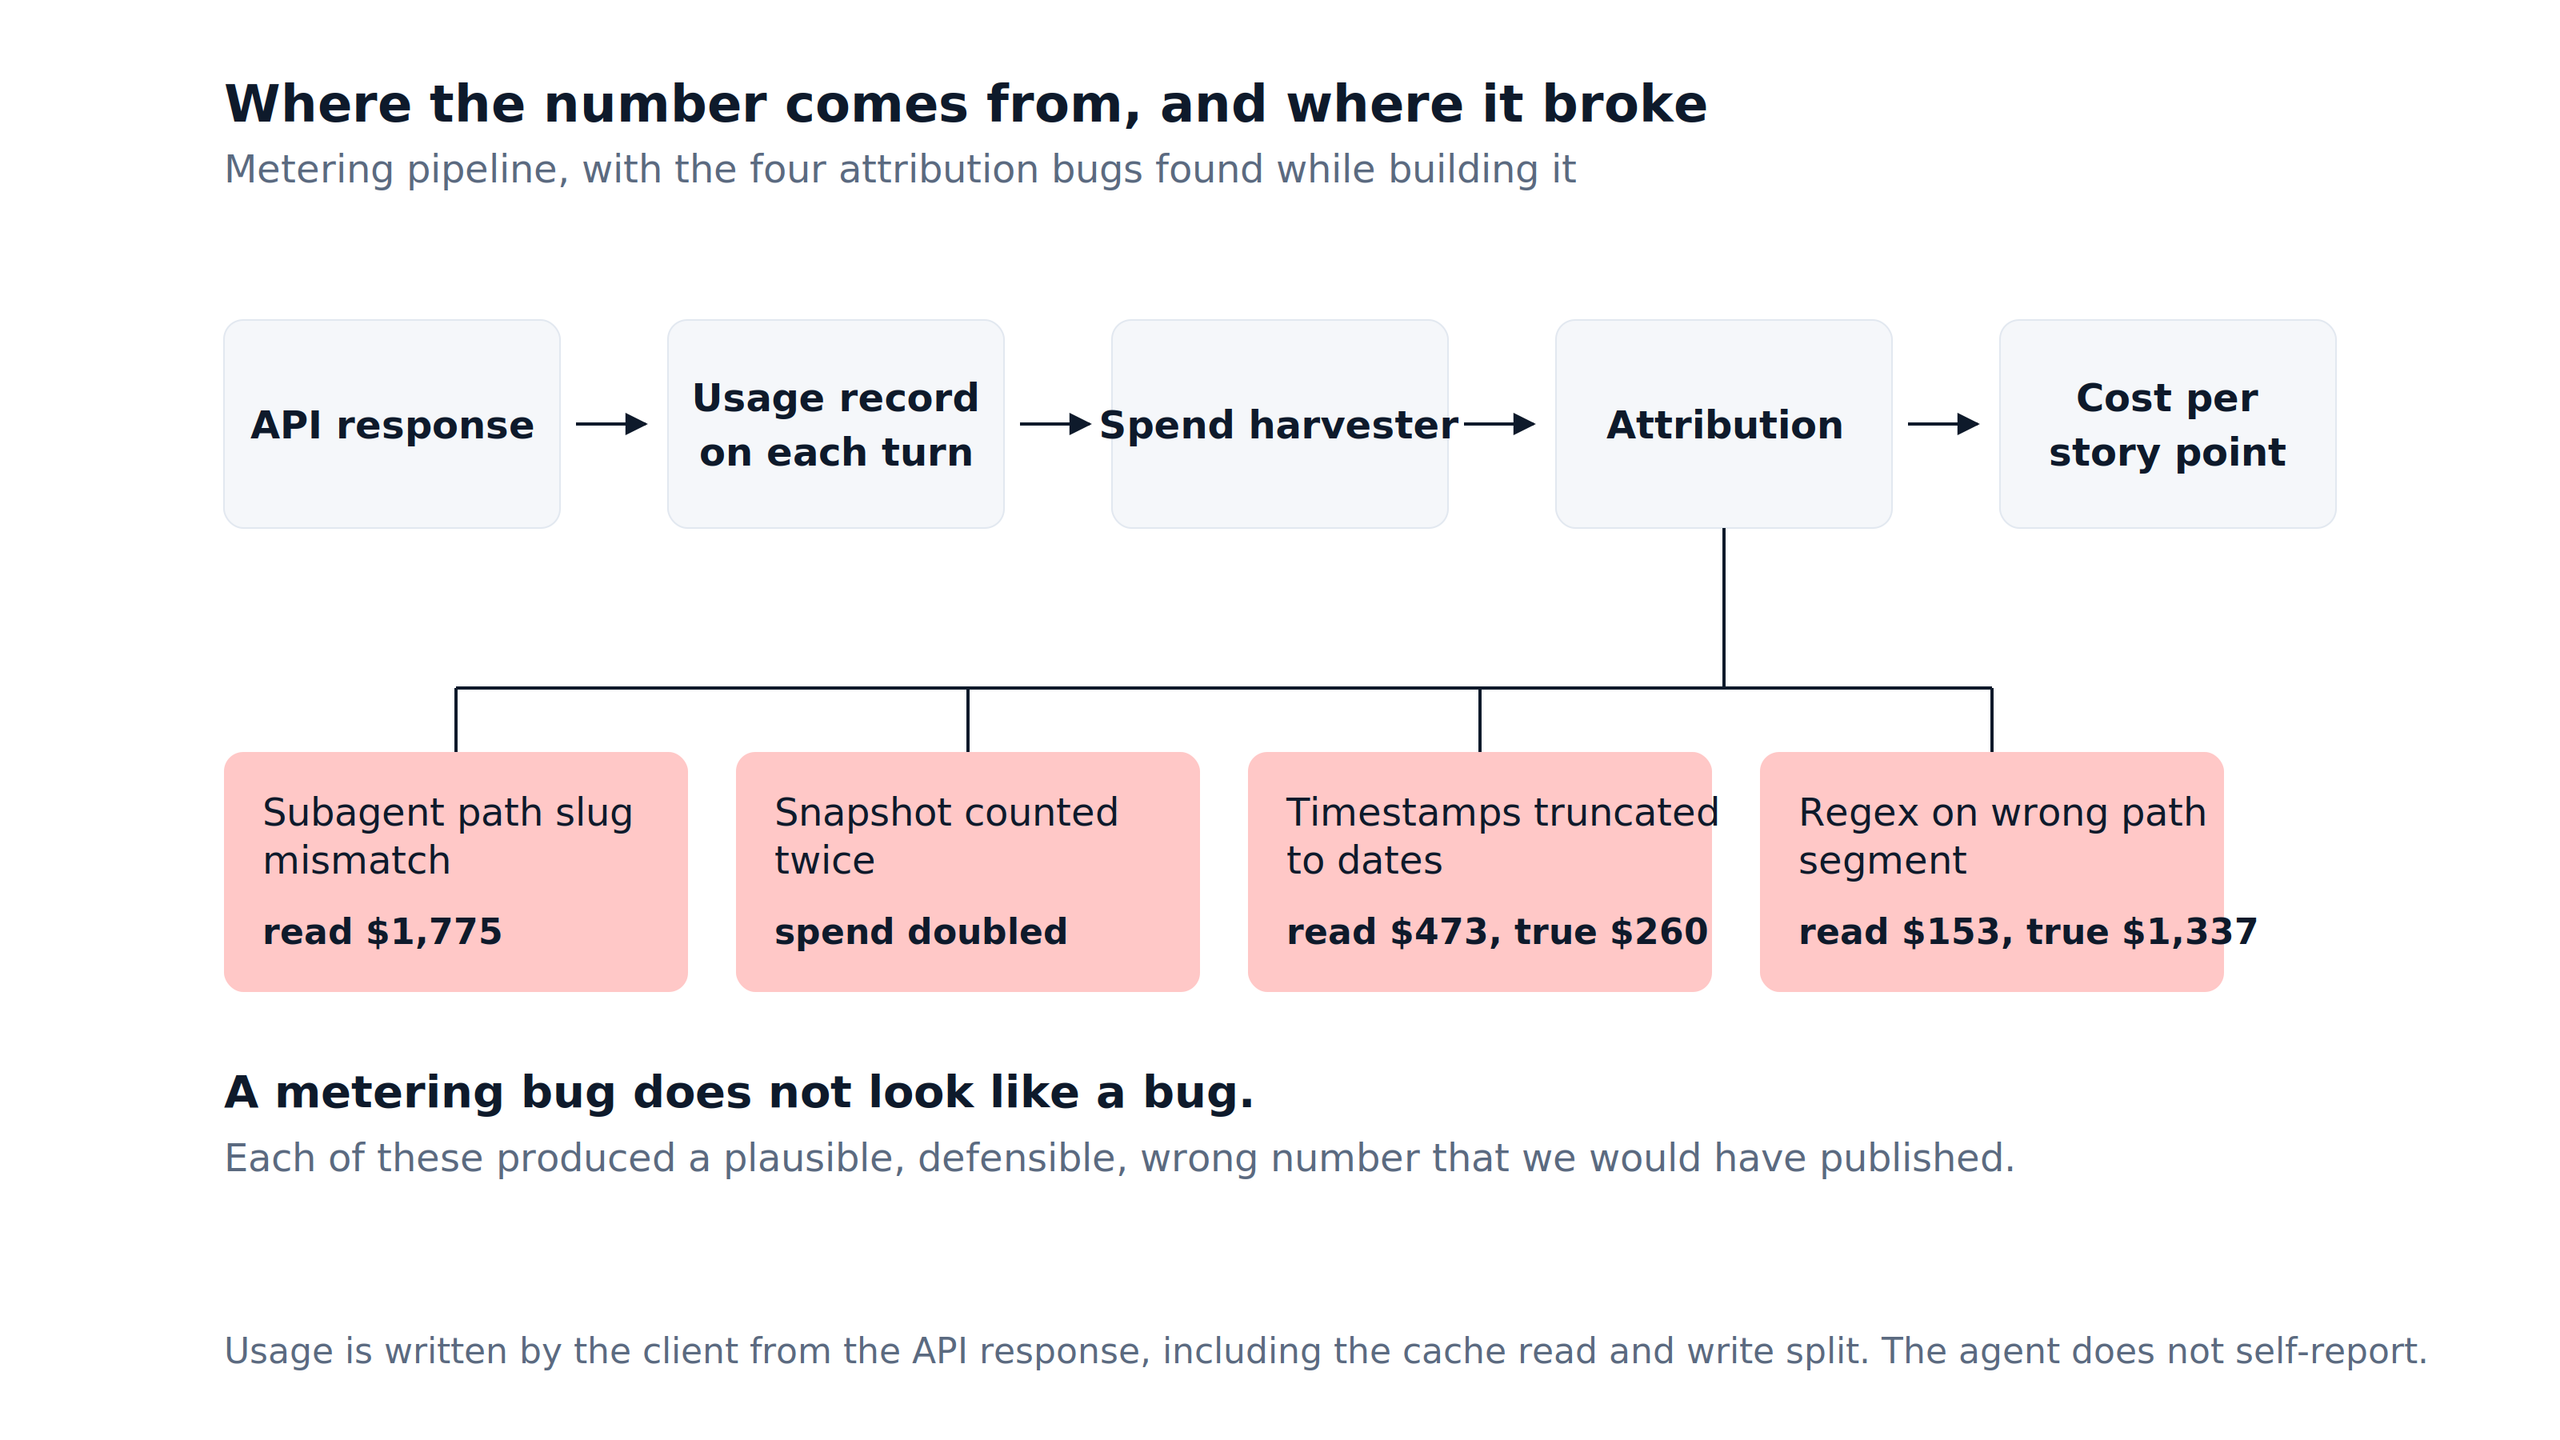
Figure 6. Where the number comes from, and the four points where attribution silently broke.
The principle generalises to any metering system, ours or yours. A metering bug does not look like a bug. A crashed pipeline announces itself. A misattributed one hands you a number in the right order of magnitude, in the right currency, moving in the right direction week over week, and wrong. All four would have survived indefinitely if the only check applied was whether the figure seemed reasonable.
Any figure checked only against itself is provisional. Reconcile against a second, independently derived source. If you do not have one, say so out loud.
One operational detail carries a deadline. Transcripts from dispatched subagents live in OS temp and get cleaned up in roughly two weeks. Metering has to capture them inside that window. Miss it and the number is gone. It is permanently a floor.
What this changes in a pricing conversation.
Ask a delivery partner what a piece of work will cost and you get a day rate multiplied by an estimate. The rate is real. The estimate is a negotiating position wearing a spreadsheet. Every downstream argument follows from that: the change request, the overrun, the out-of-scope email. Nobody priced the work, only the time.
We can answer differently now. Across six transcript-covered engagements, 517 delivered story points cost $4,404 in model spend, or $8.52 per point at list rates. Cost per story runs around $33, with a median of $11 for a small story and $18 for a medium one. Across 24 measured sprints the mean was $169, the median $146, and the range $10 to $533.
That is not a price. It is the input cost of governed AI-augmented delivery, and a number a client can hold us to. Almost nobody in this market can quote one, because almost nobody instrumented the work while it ran. Costs get reconstructed from invoices afterwards, which measures what was billed rather than what was consumed.
What changes in the room is the burden of proof. “What will this cost?” stops being a question about our confidence in an estimate. It becomes a question about the client’s backlog: how many points, and which shape of work.
What these numbers are not.
The whole argument rests on measurement discipline, so here are the limits.
These are public list prices, not invoices. They cover AI coding cost as model spend only. Human time, tooling and infrastructure sit outside.
Several figures are floors. Where subagent transcripts expired before metering caught them, that spend is missing. The true number sits above $8.52, not below, and we will not guess by how much.
We excluded two projects for thin transcript coverage, not because they were cheap. The set is instrumented, not flattering.
We could not price a requirements or design document defensibly. The bounds came out twenty to eighty-five times wide, which is not a measurement. Ask anyone quoting a confident cost per PRD how they bounded it. We could not measure a large story at all.
We could not separate marginal from fully-loaded cost. Story windows are wall-clock, so they capture concurrent work in the same period. Both measures converge at about $8.50, and that convergence is an artefact of the method rather than a finding.
Not every engagement here is a ServiceNow build. The window covers regulated data pipelines, agent builds and our own web platform alongside platform work. The delivery process and its evidence trail are the same on all of them. The platform is not, and we keep that distinction visible.
Limits that will not go away
Model prices change, mostly downward. Every figure is a snapshot against a list that has already moved repeatedly. The per-point number has a shelf life. The method carries forward.
Cost per point is not cost per outcome. A cheap point that shipped the wrong feature is the most expensive line in the ledger, and no unit-economics table will show it to you.
Points are an internal unit, and they inflate. The same system whose efficiency they measure also estimates them. If our points quietly shrink, cost per point improves while nothing real changes. The defences are stable estimation practice, comparison across engagements, and always publishing the denominator: 517 points, six engagements, printed beside $8.52 every time.
The result that would change our mind
We measured the cost of delivering, not the cost of owning. Our rework figure of 1.9% of sprint spend is rework caught inside the sprint. GitClear’s maintainability findings operate on a two-to-three-year horizon we have not lived through on these codebases.
If our maintenance costs in two years track the industry’s rather than our in-sprint numbers, then $8.52 was the wrong unit. The honest metric would be cost per point per year of ownership. That is the result that would change our mind, and we are now instrumented to detect it.
What to ask any AI delivery partner.
Worth asking of us too.
- What did your last ten engagements cost per unit of delivered work, and how did you measure it? If the answer is a day rate, they measured headcount rather than delivery. A partner who cannot produce a denominator is measuring consumption.
- What is the spread, not the average? A blended figure with no distribution means they have not looked, or would rather you did not.
- What share of spend produces evidence rather than code? If the answer is small, ask what checks the work. Then ask to see the evidence pack. A governance claim that cost nothing was never implemented.
- What is your QA to debug spend ratio? It tells you whether the team prevents defects or chases them.
- What is your cache read share? It sounds like an implementation detail. On our data it is the difference between $4,404 and $39,030 for identical output.
- Which engagements did you exclude, and why? The exclusion criteria are more informative than the number.
- What did you get wrong while measuring, and how do you know? We found and fixed four attribution bugs during this analysis. Each produced a plausible, defensible, wrong number that we would have published. An analysis with no corrections has usually not been checked hard enough to have any.
Why anyone can run this
For the market, the useful shift is not our number. It is that a number now exists, produced by a method someone else can run.
Speed claims are unfalsifiable without a baseline the buyer controls. Unit cost is different. It is money spent over scope delivered, and both halves are countable. Any partner running agentic delivery already holds the numerator in their billing data and the denominator in their tracker. The division is not routine only because nobody has asked for it.
So ask.
Bring us one story. One real item from your backlog. We will run it through the governed model described in this series and hand you the evidence pack, including what it cost. You keep the record either way.
We would rather publish the number and be corrected by it than keep selling a multiple.
FAQ.
AI coding cost and vibe coding cost
What is the AI coding cost per story point? On our measured set, $8.52 per delivered story point in model spend, across six engagements and 517 points, computed at public list prices. The wider sample runs to nine engagements, 618 points and 52,654 individually priced model turns. That figure covers model spend only. It excludes human time, tooling and infrastructure, and several components are floors rather than totals, because some transcripts expired before metering captured them.
How much does vibe coding cost, and is governed AI delivery cheaper? Published vibe coding cost figures are subscription and token numbers: roughly $16 to $50 a month for one tool, two to three times that during active building, and commonly $2,000 to $15,000 all-in for a production application, plus $5,000 to $30,000 if it later needs a professional rebuild. Governed delivery is probably more expensive per token, not less, because it pays for verification that vibe coding skips by definition. In our data that verification is 38% of the bill. The difference is not price. It is that the spend is attributable to delivered scope and the output arrives with an audit trail.
Prompt caching, AI agent cost and the levers that matter
What is the biggest lever for reducing AI coding cost? Prompt caching and session shape, not model choice. Cache reads were 96.9% of input volume in our data and bill at one tenth of the standard input rate, so the same work priced without caching would have cost roughly $39,030 instead of $4,404. That is an 89% prompt caching cost saving on identical output. The spread between the two models we use most was small beside it. One of our own sessions ran 79% of its usage above 150k context, where cache read exceeded output by roughly 250 times.
How do you control AI agent cost across many sessions? By finding the tail rather than trimming prompts. Across 332 sessions our median session cost $4.31, while the top ten sessions carried 39% of all spend, and the most expensive single session ran 62 times the median. Any optimisation that misses the long sessions is noise. The practical control is splitting sessions at natural work boundaries, because context accumulates monotonically and every added token gets billed again on every remaining turn.
The Gartner forecast and the cost per story point comparison
Will AI coding cost really exceed developer salaries? Gartner forecasts that by 2028 AI coding cost will overtake the average developer’s salary, driven by token consumption and consumption-based pricing, with 6% of organisations already above $2,000 per developer per month. On our data that is not yet the situation, because model spend per delivered point stays small beside fully loaded labour cost per point. Gartner’s named causes are ungoverned agent autonomy, bloated context windows and no feedback loop on usage. Those are process failures rather than price failures, and they are the same three things our own cost data points at.
How does $8.52 per point compare to a conventional team? A commonly cited worked example puts a human team near $958 per story point in fully loaded labour, with many teams around twice that. Our $8.52 is model spend only, so the two are not the same denominator and nobody should divide them. What the comparison shows is that the token bill is the small line, and an organisation optimising it while leaving the delivery model unchanged is optimising the wrong number.
Method, governance and what the numbers do not cover
Why does governance take 38% of spend? Is that not overhead? It is the deliverable rather than the overhead. Code is the cheap part of delivery now and widely available. What stays scarce is code arriving with a timestamped record of who decided what, what was checked against which criterion, and what was deferred and why. Build took 26% in the same period.
How do we know these numbers are real and not reconstructed afterwards? The API client attaches usage to every assistant turn from the API response, including the cache read and write split, and we harvest it rather than asking the agent to report it. That is the billing path, not an estimate. Four attribution bugs surfaced while building the metering, each producing a plausible but wrong number, and the article describes each one along with the false figure it produced.
Is $8.52 per point cheap or expensive? We cannot say, and that is the finding. We searched for a published comparable, meaning anyone dividing AI delivery spend by delivered scope, and found none. Benchmark cost-per-task figures do not compare, because a benchmark instance is not a governed unit of client scope with acceptance criteria, QA and an audit record attached.
Does this apply to ServiceNow delivery specifically? The process, the gates and the evidence trail are the same across every engagement in the set, and that is what the cost figures measure. The window includes regulated data pipelines, agent builds and our own web platform alongside platform work, so the per-point figure is not a ServiceNow-only number. For how the same model runs on a heavily customised platform estate, see AI SDLC Governance and Who tests the AI-generated apps.
Kostya Bazanov, Managing Director, Aug 22, 2026
Provenance
Every figure here derives from the usage record the API client attaches to each assistant turn, priced at published list rates. We harvest it with the spend harvester in our AI SDLC framework (v1.16.0), which is the same script and the same session-close protocol we run on live engagements. Sample: 52,654 priced model turns, nine engagements, 618 delivered story points. Of those points, 517 sit in the six engagements with complete transcript coverage that produce the $8.52 figure. Engagement-level detail stays in private engagement workspaces.
Kostya Bazanov, Managing Director, Aug 25, 2026
Eager to take the next step? Contact us today!
Latest Articles

Teiva Systems at ServiceNow AI Summit 2026 — Munich
On October 7, 2026, Teiva Systems joined the ServiceNow AI Summit in Munich, where industry leaders, innovators, and the ServiceNow community came together to explore the next chapter of enterprise AI and intelligent automation.
read more
Automated Testing in ServiceNow: How Now SDK, ATF and CI/CD Work Together
Automated Testing in ServiceNow: How Now SDK, ATF and CI/CD Work Together Automated testing in ServiceNow is becoming more important, not because ATF or CI/CD are new concepts, but because the way they can work together is changing the development lifecycle itself. As ServiceNow moves toward a more source-driven engineering model, testing is becoming less […]
read more
ServiceNow CI/CD with Now SDK and GitHub Actions: What Changes for Developers
The Now SDK connects ServiceNow application development to GitHub Actions CI/CD pipelines — bringing pull-request quality gates, automated ATF testing, and controlled release governance to a platform that has historically required its own isolated delivery process.
read more